Reading a stock chart doesn’t have to be rocket science. Stonks don’t move in straight lines — they wiggle, dip, and moon in patterns you can actually learn to read. That’s why traders live on stock charts. But to the untrained eye, a chart looks like Matrix code: green and red blocks stacked on each other. Don’t worry — once you know the basics, it’s not rocket science.
Meet the Candlestick
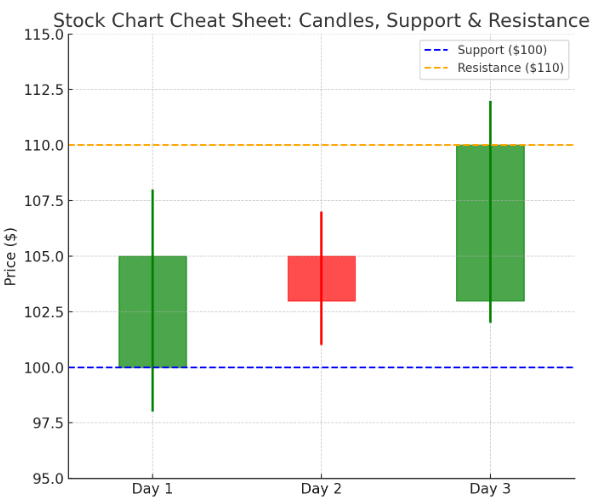
Forget boring line charts — real traders use candlesticks. Each candle shows four things:
- Open → price when the period started.
- Close → price when it ended.
- High → top wick = highest price.
- Low → bottom wick = lowest price.
If the candle’s green → price closed higher than it opened (bullish).
If it’s red → closed lower (bearish).
Think of them as little mood indicators for the market.
Every candle tells a story — who’s in control, bulls or bears. A single red candle might mean nothing, but a cluster forming near previous highs? That’s potential exhaustion. Reading a stock chart means watching those shifts like footprints left by traders before you.
Support & Resistance: The Invisible Walls
Markets love to bounce around certain price levels:
- Support = price “floor.” When a stock keeps bouncing up after hitting the same low.
- Resistance = price “ceiling.” When a stock struggles to break past a certain high.
Traders watch these levels like hawks. Break above resistance? 🚀. Fall below support? 💀.
Support and resistance aren’t magic lines — they reflect crowd psychology. The more times a price bounces off a level, the more traders notice it. When it finally breaks, that’s when things move fast. Reading a stock chart helps you see those tension points before they snap.
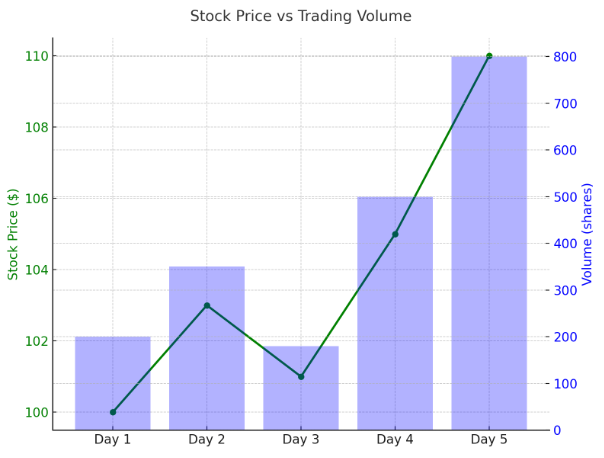
Volume: The Crowd’s Energy
Volume = how many shares are traded. It’s the “crowd energy” behind a move.
- High volume = conviction. Big money is moving.
- Low volume = meh, not many care.
Pro tip: A breakout with high volume is way stronger than one with weak volume. Always check the crowd before you trust the move.
Putting It Together
Imagine a stock hovering at $100:
- Support at $95 keeps saving it from falling.
- Resistance at $105 keeps blocking it.
- Volume spikes every time it tests $105.
If it finally smashes past $105 on huge volume → that’s a strong breakout. Traders pile in.
The goal isn’t to predict every move — it’s to read the story as it unfolds. The more charts you study, the more your eyes adapt to spot setups automatically. Reading a stock chart becomes second nature, like recognizing a familiar face in a crowd.
Reading a Stock Chart in Real Life: Example Walk-Through
Picture this — you’re looking at a chart of a company that traded around €40 for weeks. Then you see a green candle with a long upper wick, volume spikes to 3× the average, and the price breaks above a horizontal line it couldn’t cross before. That’s your cue: you’re reading a stock chart showing a potential breakout. You zoom out, see it’s been testing the same ceiling for three weeks, and notice institutional activity creeping in (volume).
But you pause — why? Because reading a stock chart means combining the visual with context: Is there news? Earnings coming? A sector trend? Only when you align all that do you get a higher-probability signal. And remember: even then it’s a probability, not a guarantee.
Use this example in your trading journal: pick a chart, mark support & resistance, check volume, note the candle shapes. The more you practice reading a stock chart this way, the more you’ll start spotting patterns rather than guessing them.
Common Rookie Mistakes
- Ignoring volume. Price moves without volume are often fake-outs.
- Over-drawing lines. Support/resistance zones are approximate, not exact.
- Thinking candles predict the future. They show what happened, not destiny.
- Forgetting fundamentals. Charts + company news = better decisions.
Takeaways
- Candles show open, close, high, and low prices for a given time.
- Support = floor, resistance = ceiling.
- Volume tells you how much conviction is behind a move.
- Breakouts matter more when volume is high.
- Charts help you spot probabilities, not guarantees.